
Study of NanoVi® Device – Impact on Immune Response
University of Vienna, Center for Sports Science
Research conducted at the Center for Sports Science at the University of Vienna evaluated blood lactate and inflammatory markers after exercise-induced oxidative stress. Researchers addressed the question: “What is the impact of inhalation from the NanoVi™ device on regenerative capacity –measured by changes to the redox balance in terms of how the immune system responds following an intensive training session?“ The results outlined below describe the impact on white blood cells. Results relating to lactate were also compelling and are summarized separately.
Objective: The objective of this empirical study was to describe the effect of NanoVi™ bio-identical signaling on blood markers for immune response.
Overview of methods (details below)
- Double-blind crossover study design
- Active NanoVi™ and inactive placebo devices were indistinguishable to researchers and athletes
- 21 healthy male athletes were evaluated
- Diet, supplementation, and exercise were controlled prior to testing
- Testing was done with the NanoVi Pro™ device. Two sessions were each half the standard recommended length
- Venous blood was drawn at five different time points: t-30(before the first session), t0 (after the first session), t55 (after the all-out exertion test), t85 (after the second NanoVi™ session), and t205 (two hours after the second session)
- Leukocytes and the subcomponents Granulocytes, Monocytes and Lymphocytes were measured as indicators of regeneration associated with immune response
- GSH/GSSG ratio was measured as an indicator of oxidative stress
- Hematocrit and Hemoglobin levels were measured to reveal the oxygen carrying capacity of the blood
- A p-value of 0.05 was required for results to be considered statistically significant
Results
White blood cells (Leukocytes) and three sub components were evaluated to assess the subject’s regenerative capacity. After physical depletion, there is an increased risk of infection and illness. The immune system responds with an increase in white blood cells to defend against infectious disease and foreign bodies. In addition, some blood components contribute to tissue repair. Results confirmed that the NanoVi™ device was associated with a stronger immune response. All white blood measures except Lymphocytes showed that the NanoVi™ group was significantly higher than the placebo group at t85. The t85 point was after the second NanoVi™ session that immediately followed the all-out exertion test. Measures of oxidative stress and red blood cells did not show statistically significant results.
Leukocytes
For Leukocytes, the average value of the NanoVi™ group was 10.3% higher than the placebo group at time point t85. As expected, there was virtually no difference for the first two time points, prior to exertion. The NanoVi™ group was higher for the three remaining time points and was statistically significant at t85 (p=0.03), after the second NanoVi™ session.
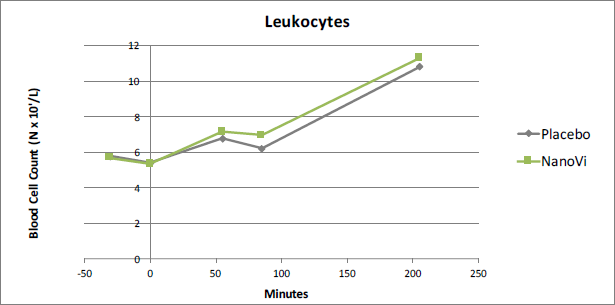
Figure 1. At time point t85 Leukocytes were 10.3% higher in the
NanoVi™ group than the placebo group, significant at the 0.03 level.
Granulocytes
As was the case for Leukocytes in general, Granulocytes were significantly higher after the second NanoVi™ session which followed the all-out exertion test. In this case the difference was 14.0%, significant at the 0.02 level. Granulocytes provide a generalized immune response and are the most common type of Leukocyte.
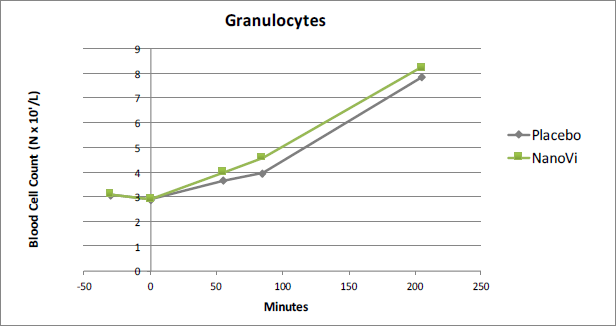
Figure 2. At time point t85 Granulocytes were 14.0% higher in the
NanoVi™ group than the placebo group, significant at the 0.02 level.
Monocytes
Results showed that Monocytes were 16.9% higher in the NanoVi™ group than in the placebo group at t85. This was the greatest difference measured in the white blood cells and was statistically significant at the 0.02 level. A strong activation of Monocytes is of particular interest to athletes because monocytes assist in the process of mending damaged tissue, in addition their function in eliminating and protecting against bacteria, fungi, and viruses.
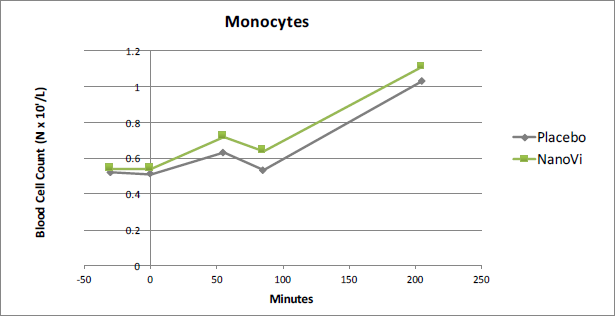
Figure 3. At time point t85 Monocytes were 16.9% higher in the
NanoVi™ group than the placebo group, significant at the 0.02 level.
Lymphocytes
Lymphocyte testing did not show significant results. The largest variation was at t-30, the time point preceding intervention. For the time points following intervention, t85 and t205, the two groups were virtually identical. This suggests analysis error. Tests of other white blood cells showed little difference between the NanoVi™ group and the placebo group at t-30 and all showed measurable variation after intervention.
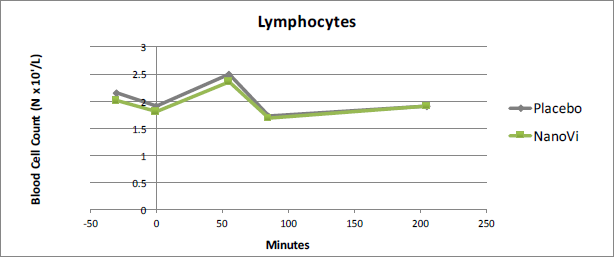
Figure 4. Lymphocytes showed no significant difference between the
NanoVi™ and placebo groups. Results were suggestive of analysis error.
Oxidative Stress Levels
As markers for oxidative stress, the GSH, GSSG and the GSH/GSSG were studied. None of these measure showed significant results. The measurement of GSSG showed a 16% difference at t-30, the baseline time point before intervention. This is an indication of analysis error and retesting may be warranted.
Red Blood Cells
The average measures for both Hemoglobin and Hematocrit were consistently higher for the NanoVi™ group but were not statistically significant. For the red blood cell measures, there were large variations between subjects. This was attributed to either large disparities between individuals or problems experienced during analysis.
Conclusion
This study verifies the regenerative capacity of the NanoVi™ device. The immune system was influenced by a 15-minute session (half the normal session) done prior to physical exertion, as reflected in lactate levels (lactate results are summarized elsewhere). When a second (half) NanoVi™ session is done after exertion, white blood cells show substantially higher immune response in the active NanoVi™ subjects.
Full Description of Study Methods
Subject Selection
For inclusion in the study, athletes met the following criteria:
- Male, between the ages of 18 and 35
- Amateur athletes with experience in running (regularly running more than 1.5 hours / week for more than a year)
- BMI ≥ 20 and <25 measured as kg/m2
- Non-smoking
- Good physical condition and overall health
- No use of supplements within two weeks of testing
Evaluation and Testing
Athletes were evaluated on three different days. A seven to 14-day washout period preceded each evaluation day. During the washout period, each athlete’s diet and exercise was controlled.
On the initial day of evaluation, the athlete’s health was assessed and a baseline for his exertion was established. Weight and height were recorded. Body composition, including body fat, body cell mass, and fatfree mass was measured using bioelectrical impedance analysis. Spiroergometry testing was used to determined the athlete’s VO2max, which is a measure of the maximum volume of oxygen that the athlete can use. VO2max measurements were used to derive the appropriate treadmill speed for the all-out test. The treadmill speed was calculated to have athletes exerting at 75% of their VO2max. This made it possible to develop a different protocol for each athlete.
Prior to each of the two testing days, all participants fasted overnight and were given a defined, high carbohydrate breakfast. Venous blood was sampled 30 minutes before the all-out exertion test, time point t-30. Participants were randomly assigned to a device. Neither the athletes, nor the investigators knew which of the two devices was the active NanoVi™ device. Athletes then had a 15-minute session on the NanoVi Pro™ device, followed by a second blood test taken at time point t0. The all-out endurance test was run; then the third blood test was taken at t55. After a second NanoVi™ session was administered, blood was drawn at t85. Athletes then had a relaxation period with the final test taken two hours after the second NanoVi™ session at t205.
During the all-out exertion tests, each athlete did a five-minute warmup at 8 km/hour then ran 45 minutes at the speed derived from Spiroergometry testing. This was followed by a treadmill speed increase of 5% of the previous speed every two minutes until exhaustion. The exertion test was either terminated voluntarily by the athlete or by the attending physician. During testing, heart rate was monitored and respiratory gases were measured every 15 minutes to ensure the training intensity was safe for the athlete.
The second day of testing was done between seven and 14 days after the first test (the washout period). Runs were performed exactly the same way, but active and inactive devices were switched so each subject received the opposite of what they had on the first testing day.
Analysis
Venous blood was drawn at each of five different time points: before the first NanoVi™ session (t-30), after the NanoVi™ session but before exertion (t0), after the all-out exertion test (t55), immediately after the second NanoVi™ session (t85) and two hours after the second NanoVi™ session (t205). Over the course of the two test days, a total of 10 blood samples were collected for each subject. Each test drew 20ml of venous blood. All blood processing was done by staff in the Molecular Physiology group at the Austrian Institute of Sports Medicine.
Statistical analysis was performed using SPSS 22.0 and Excel. Initial results were checked for normal distribution by the Kolmogorov-Smirnov test. Statistical significance was tested using the T-test for independent samples informed by the spreadsheet for fully controlled crossover studies developed by Hopkins (2005)*. Results were considered significant if p was ≤ 0.05.
*Hopkins, WG (2005). A spreadsheet for fully controlled crossovers. Sportscience, 9.

